LQD vs. SPYMay be looking too closely into this, but the 4hr ratio chart is breaking out from diagonal resistance and the RSI is forming a new high, all while not reaching oversold..
Search in ideas for "RATIO CHART"


S&P Next Week Expected Move ($81.50)Chart Dump Post. Good luck next week everyone.
- RH
last Week:
Long Term Breadth:
Short Term Breadth:
XLF relative strength compared to SPY LEADS Yields:
Copper/Gold Leads Yields:
Nasdaq 161.8 Fib Extension:
TNX:
TLT:
Semiconductors LEAD QQQ:
VIX:
VIX3M:
VIX6M:
VPD:
VVIX:
VIX/VIX3M
ISM_PMI:
Bitcoin Update:

Chinese Tech vs US TechChinese Tech vs US Tech | I don’t know if you’ve had a look at the relative/ratio chart of Chinese Technology Sector Stocks (CQQQ) vs US Technology Sector Stocks (QQQ). My review of the chart sees China tech starting to outperform US tech on a relative basis. A major two-year downward trend line has been breached, with the price finding support on it’s 100-day moving average, which is also starting to trend higher.

Inflation?TIPS vs. GOVT breaking through a diagonal downtrend line (beginning in April '18). When it comes to Ratio charts, horizontal S/R zones are far more important IMO, but nonetheless this is an interesting development

Pairs Idea - Long SOL Short SGLEquities Pair Long SOL / Short SGL | At current levels, the price, as per the ratio chart is finding buying support at the prior swing low seen in August 2016. What is very interesting is the extension (distance) from the 200-day moving average. Using the prior swing support lows as an example we saw the price (prior to the massive bullish reversal) trading at 53% below the 200-day MA. At current levels this number is 58%, which may suggest that the price is overextended to the downside and offer an opportunity to take a position in the pair.

Pair: African Rainbow Minerals vs Sibanye GoldPair Trading Opportunity | Long ARI, Short SGL | On Friday 22 November we saw the daily candle close with a bullish engulfing formation. At the last close, the 200-day moving average is 70% above the current price of the ratio chart, signaling an extension well beyond the standard deviation. In addition, the 6 month performance of the two shares is startling, with ARI slipping by 1.57% while SGL saw it’s value increase by 134%. The current ratio level of 5.65 represents an opportunity to go long the shares of ARI while simultaneously shorting the shares of SGL. Use a stop-loss of 4.90 to protect capital with a target price of 7.20.

Platinum At A 30 Year Low vs PalladiumMonthly relative/ratio chart sees Platinum at a 30+ year low vs Palladium.

PC - VIX - SPX- Waiting for Breakout Trigger! Market Reversal?This chart is a 4 hour candle of the PC (put/calls) that is in Tradingview. It is a bit different than the cboe put/call ratios chart we are familiar with.
However with this PC indicator, we can look at the whole market of stocks. We can expect a change in the market direction - ahead of time!
Take a minute or two and really observe how this PC chart is a contrarian indicator.
It is read same way as the VIX, cboe put/call indicators, and compared to SPX.
When PC readings are high, that is when we should be looking for a bottom in the market, and begin buying!
When the indicator is low (as it is now) we should be expecting a top and look to selling the market!
Here we see the SPX as a red line in the background for reference.
The Blue vertical lines are major SPX market reversal dates.
Notice how this indicator warned us about tops and bottoms?
We are now waiting for the trigger to be pulled. When we break above the little blue line (sloped downward), we will know that "the market top is in".
We should already be in a sold position by then and look for the market prices to collapse downward.
After this happens (it always does) we begin looking for a spike high reversal day in the future...
That's our cue to begin buying stocks at a discount when fear is the highest!
We are anticipating the trigger to be pulled now! Get ready!

$SWKS Bullish upgrade for Skyworks solutions Highly dependent on trade discussions, if there is any sort of a deal its a buy, as it has lagged behind others within the sector.
Trading at a very reasonable 15.39 P/E ratio
Chart is on verge of a bullish break.
Indicators are bullish.
I Phone demand increased.
Alert set for break above $83
Upgrade details
Cowen analyst Karl Ackerman upgraded Skyworks (SWKS) to Outperform from Market Perform with a price target of $95, up from $80. The company's content continues to ramp this iPhone cycle, and higher radio frequency content in a 5G-enabled phone presents unit upside potential in 2020, Ackerman tells investors in a research note. Further, Huawei is 90% discounted into 2020 estimates, which could drive $350M in sales and 60c in earnings per share upside on a U.S./China trade resolution, adds the analyst. He also believes WiFi 6m which is "finally here," enables Skyworks to dominate in smart home applications. source Thefly

#Gold/EUR #XAUEUR - intermediate/long term analysisDue to fundamental reasons (trade tariffs, sudden currency devaluation of the Yuan and stock market crash) impulse wave 5 of Gold has broken through the blue doted resistance trend-line and is near its ATH (Gold/EUR chart).
However, there are 3 other strong resistance lines:
- dashed violet resistance trend line (currently around €1360.-)
- horizontal ATH resistance line (~ €1387.-)
- bold violet resistance line (currently around €1424.-)
According 1D, 1W and 1M momentum indicators it looks like Gold is losing its bullish momentum, also RSI and MFI are very overbought on all time frames.
(also short-term H4 and 1D at the moment o writing)
Therefore, I think Gold will be too week to break through the dashed violet line (~ €1360).
Also on the USD chart Gold is fighting with a resistance trend line.
Therefore, I think a good short opportunity will arise soon (as soon as stocks go up again) ;-)
Furthermore, I have found a “Hanging Man” in the Gold/Silver ratio chart (@1W TF) which is a bearish reversal signal.
This means that Gold is losing strength compared silver regardless of FIAT currency manipulations and currency wars.
This is a long-term signal and a perfect swing trade opportunity to exchange Gold into Silver. But unfortunately silver is taxed whereas Gold is tax-free in my country.
Keep in mind that technical analysis cannot predict exogenous risks.
This means when for some fundamental reasons there is a fire sale in stocks markets, then Gold and Silver will rally because these are safe-heaven assets with negative-Beta correlation!
Also when Gold is losing strength compared to Silver it can still go higher in terms of FIAT valuation / fake currency.
(in a very bullish scenario Gold may hit Fib extension 0.272 which is at €1446! )
I will start to buy PHYSICAL Gold again when it comes near the accumulation zone between €1213 - €1115 in the end of this year or during 2020.
In an economic collapse wealth cannot be stored on fake assets. Keep in mind that China and Russia has quadrupled their Gold reserves since 2009!
Be patient and do not FOMO. Emotions are a money killer!
I´m not a financial adviser. For educational purpose only!

NIFTY50....Oversold enough to ris?Hello Traders,
NIFTY50 declined this morning to the lower boundary of the trend channel and reversed since. The move from this low (@10924) is quite shallow and not strong, suggesting a sideways move with maybe fresh new lows on Monday or Tuesday or so.
Today`s technical are the following: a/d-ratio closed @ 0.9 (according to www.traderscockpit.com ) and the daily TRIN closed 0.4, which is a strong bullish sign.
At the hourly chart, there is to observe, that the waves from the 10782 low show overlapping structure an indicate a weakening inner structure, with new lows ahead. I am not sure if this was all of the correction, but as you know, a wave „4“ of any degree can morph into a sideways move, a triangle, for example, is- so this is one of the opportunities I am focused on.
Switch over to the weekly chart, the move from 12103 does not look complete too.
The TRIN (SMA10) @ 1.69 looks oversold enough to let the market rise again. But will he?
By the way. This is the highest oversold level for more than 1 year.
Observing the technical data for N50, the MACD and the Stochastic implicate that the market could fall for some hundred points and more. The MACD histogram has lost its speed to the downside and Stoch is still in a neutral zone, a countertrend always possible, but normally a correction is ending not in to „now where“!
Even so to observe is, that he Donchian channel act as support last week, while price touched this level, but this week's candle looks like a“Hanging-Man“, not textbook-like but still it is. And price has bounced back to the lower boundary of the upward trend channel, a „kiss good buy“?
On a weekly basis just rise above the middle line of the Donchian channel, which is it`s avg, will be a first hint that the trend may change.
As long as N50 is below the wave „iv“ high @ 11181.30 the trend is focused down and a break of the lower boundary of the channel (grey) will open the door to the 10782 area and below.
Be patent these days, times are not normal!!!
Have a great weekend...
ruebennase
Feel free to ask or comment.
Trading this analyze is at your own risk!

Silver rally should continue - Gold / Silver RatioTimed the breakout almost perfectly yesterday. In my opinion, silver bullish impulse should continue. Watching the pattern on this Gold / Silver Ratio chart for signs of exhaustion....

Next Week Expected Move ($32) and Gravity Points + ExtraThink we're going into a melt up. Powell all but confirmed a rate cut. Last week I mentioned watching Bonds closely, and that played out well.
I've had a long term target from 2017 coming into play here, we'll see what happens and if technicals remain relevant over longer time frames.
Earnings next week can shift the narrative either direction. I think much has been priced in, both bullish and bearish.
Last Week's Post:
Extra -
Unfilled Gaps:
Value Line Geometric Divergence:
HYG/TYX Divergence:
Small Caps Look Interesting:


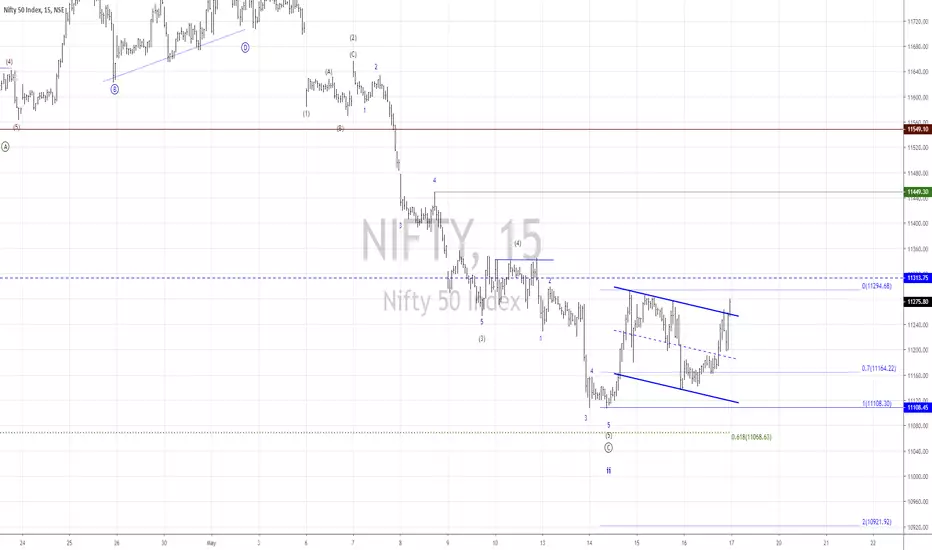
NIFTY50....Building a bottom!Hello Traders,
NIFTY50 made a low at 11108.45 and start an advance since. This move could be wave „1“ of a larger uptrend, that can led N50 to new highs.
At the short term the move up is not a clear „five-up“ but the slope of the advance is one argument for this. The second leg up, started at 11137.45 on May 15 is countable as a „slit up“ wave, a series of „one`s „ and „two`s“. If so, the low at 11108 is the bottom of a possible wave „ii“ and we are at the early stages of a wave „iii“!
On the other hand, any decline below the 11108 will extend the decline throug the 0.618 Fibonacci of the wave „1-2“ at 11068 points. More bearish potencial exist.
Todays a/d-Ratio was strong at 3.5, support the view of a new advance. By checking the broader NSE market data, you will observe that there is, in contrast to NIFTY50, an a/d-Ratio of 0.76, slightly negative. www.traderscockpit.com
This divergence is to observe in the coming hours. The broader market has to move in unison either up or down to establish a trend.
If anything new develop, we will discuss it here.
Have a great week...
ruebennase
Feel free to ask or comment.
Trading this analyze is at your own risk!
GDXJ:GDX Ratio ChartGold is headed to $1680 in October 2019... Gold stocks will confirm breaking out above overhead resistance congestion area.

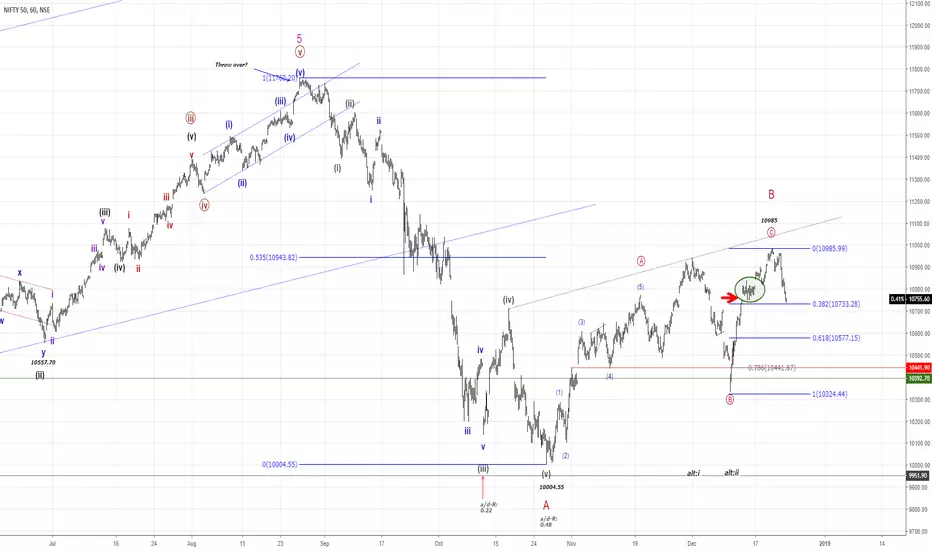
NIFTY50...Wave "B" done or up to new highs?Hello Traders,
I wish you merry christmas and happy holiday.
As of my last analyse has gaped higher, after taking a „deep breath“ to a new countertrend high. N50 also created a „Island reversal gap“ which often indicate a change of trend.
So by observing the hourly and 15 min chart, since the high at 10985 a sharp cecline to the downside is in progress. The first countertrend from 10985 to 10880 was just retraced by 0.8 tics of the 0.786 retracement. So the odds are to favor, that as long the high at 10985 is in place, the next move is focused to the downside and will lead to an impulsiv structure.
Another pretty good view is to check the SGX NIFTY INDEX Future that too shows the strucure with overlapping waves amd a retracement just shy below the 0.618 Fibonacci.
On the longterm chart you will observe that it is poosible to count a complete „five-up“ which will lead definetly to a correction that has started at 11751.80. The drop down to 1003 is either wave A of this correction or it is done. To my view it is not done, because it is not clear to watch that this drop is a „three-down“! So we might had a Wave „A“ down, a „B“ up and next is „C“ down to fresh new lows. A solid break of the red trendline, that connect the lows from 2008-10-13 @ 2252.75 and 2016-02-29 @ 6825 will a first hint that the wave C down is underway. It is to early to call a price target for such a drop but a possible range could be at 8710. More bearish potencial exist!
On the short term view, price have come back to a 0.382 Fibonacci from 10333-10985. This level is often an important one and will show some reaction by traders and investors. It is quite possible that price will bounce for some hours to correct this drop.
As long as the high at 10985 is not exceed the focus is to the downside. A sizeable targetzone is around the 10582, a 0.618 Fibonacci.
A solid close below the 10473 will increase the odds for a ongoing decline in N50 while a solid cross above the level of 10880 will eliminate the bearish idea of an impulsiv structure, `cause we will get a „wave cut“ and indicate an a-b-c move, so the next push will be to the upside.
The graph below the analyse show you the TRIN (Arms Index) which is often use as an indicator for oversold/overbought levels. There is nothing to observe that show some extraordinary conditions.
www.traderscockpit.com
Just a quick look to the „option chain“ shows some interesting position in case of OI for N50! There is a huge OI around the 10K area which possible will lead N50 to a sharp decline within the next days or weeks, because investors will do „everyhing“, sooner or later, to get there positions „into money“! The Put/Call-Ratio (Dec 27, 2018) for NIFTY IT shows a Ratio of 2 that suggest a bearish sentiment too.
I will update the chart if the odds have changed or a clear wave strucure is to observe.
Have a great day...
ruebennase
A bullish take on SemiconductorsHere's a ratio chart of semiconductors versus the SP500 which suggests that we could still expect some decent upside from semiconductors and technology in general despite it's out performance over the last few years. It's too early for me with this one but I will be looking out for any decent moves upwards.


Bitcoin: Flip-Flop EditionHello!
Multi timeframe analysis is there.
Recently we meet Local resistance at $6514 (red horizontal line) Which is bottom of Descending Triangle (Red on 2D chart at left).
Now it need to break $6514, to move on higher resistance $735 2, which will be hard for bulls IMO.
If bulls will fail breaking this resistance, we will probably see reloaded bears for final rush to The Trend and Global Support, where the huge demand is located:
Global Support $4790-5000
Watch price movement on 1h chart and wait for price action in Yellow Circle, as here we've got 2 resistances.
Good luck!
Learn more from previous ideas:
June 13, Wyckoff Accumulation Process for BTC:
June 26, Bitcoin Price Prediction for 2018:

NIFTY50....Like to see more evidenceHello Traders,
the low at 9951.90 from March,23 is still in place. The first move to the upside rose to 10205.50, a wave (a) high, the pullback was very shallow to 10096.90. This pullback retrace just a bit mor than 0.382 of the first up leg, which make it a possible (b) wave. Todays 10255.35 set a new intraday high and fullfilled the minimum expectation for a wave (c)! I think this move isn`t done for now and the possible targetzone is at 10350-10447!
While there are some other options for Elliott patterns, I like to show one more to you.
The move from 9951.90 can be also be counted as an Impulse wave, which endet at 10207.90! The pullback was of course even very shallow and endet even at 10096.90 and make it a possible wave 2 move! So, the running advance is a wave 3 up to new fresh highs to ~ 10500 area!
Advance/decline-Ratio for N50 was solid at 1.50 today, as it shows an impressive strength the last days.
This support the view for a fresh new advance. But I like to see more evidence for this idea.
For shortterm traders the level at 10096.90 is important and trading above that level is a solid indicator for higher prices still.
Trading below 10096.9 with a solid volume and at minimum 2-3 hours closings below will decrease the impulsive idea!
The broader market is rising in unison to new fresh intraday highs and the INR is stortterm moving sideways and trend is focused down shortterm!? The a/d-Ratio for the broader NIFTY was at 3.40, a strong level! (www.traderscockpit.com)
So, as before, I like to see more evidence for the period on an hourly and 4h timeframe to come to a new solid forecast.
So, at least take notice at chart for NIFTY50 of both, the blue declining trendline and the dotted red rising one. At this levels I think a decission will be met!
A failed breakout out or a massive Gap above that level can be next in trading in the comin days!
Be prepared for the unexpectedd!
Have a great day...
ruebennase
Questions and Comments are welcome!
Note!---> This analysis can be wrong. It is just in my view the one with the most probabiltity with the Data which are available to me and by my interpretation of the EW Theory. If you trade this it is done by your own risk and decision! Keep that in Mind!!!
Data by NSEIndia.com and moneycontrol.com!

03-27 EXK Chart (by Got Goldies)When u see my Gold to Silver Ratio chart you will find jackpot awaiting. And then what about my double quadruple line formation for Silver?
